The Course Signals team presented at the Second International Conference of Learning Analytics and Knowledge 2012 (#LAK12) a few weeks ago in Vancouver, BC. They showed some very impressive results that ensure their position at the head of the pack in terms of practical impact on students’ lives. They also may have found an impact from their technology that could potentially disrupt college admission practices in a significant way (See the “A Surprising Result” heading below).
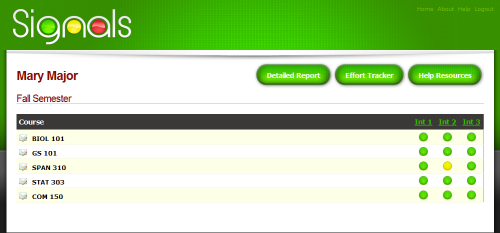
Course Signals is a student risk identification system designed by John Campbell and others at Purdue that enables faculty to systematically intervene during the course of a class in measure with a student’s level of risk. It facilitates three primary phenomena:
- Faculty/student engagement
- Student resource engagement
- Leaner performance analysis
It uses a predictive student success algorithm (SSA) to calculate a student’s level of risk based on four main factors:
- Performance: “measured by percentage of points earned in course to date”
- Effort: “as defined by interaction with Blackboard Vista, Purdue’s LMS, as compared to students’ peers”
- Prior academic history: “including academic preparation, high school GPA, and standardized test scores”
- Student characteristics: “such as residency, age, or credits attempted” (Arnold & Pistilli, 2012, pp. 1–2).
The user interactions it facilitates are:
- “Posting of a traffic signal indicator on a student’s LMS home page
- E-mail messages or reminders
- Text messages
- Referral to academic advisor or academic resource centers
- Face to face meetings with the instructor” (2012, p. 2).
In the workflow, an instructor sets up before a course starts how many times the SSA should be run (e.g. once a week) and then creates the feedback (referrals to resources, academic advisors, or with instructor, etc.) that students should receive per level of risk per instance of the SSA. The instructor is then in high touch communication with the students with individualized feedback with minimal effort. And it seems to work, “Most students perceive the computer-generated e-mails and warnings as personal communication between themselves and their instructor” (2012, p. 3).
Results
Course Signal’s first pilot was in 2007 so they have a significant amount of performance and evaluative data, putting them a few years ahead of any other system out there.
Retention:
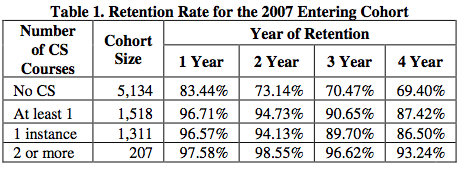
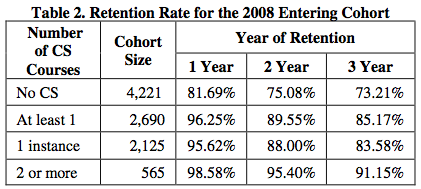
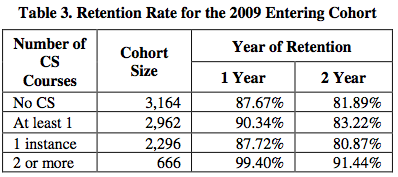
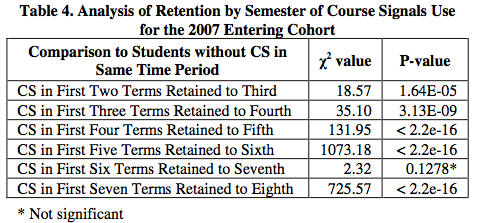
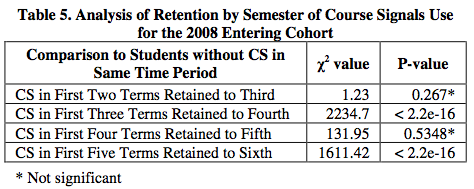
It is notable that the more classes with Course Signals students take, the more likely they are to be retained in subsequent years of schooling. For example, in the 2007 cohort, for the students with 2 or more Course Signals classes in any given year from year 1 to 4, the percentage of those students retained from one year to the next was mostly in the high 90s. In contrast, the percentage of students retained from year to year with no exposure to Course Signals classes from the same cohort in the same years ranged from the high 60’s to the low 80s (2012, p. 3). See the tables below.
Grades:
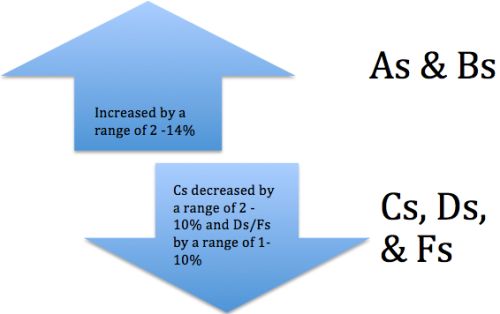
“Combining the results of all courses using CS [Course Signals] in a given semester, there is a 10.37 percentage point increase in As and Bs awarded between CS users and previous semesters of the same courses not using CS. Along the same lines, there is a 6.41 percentage point decrease in Ds, Fs, and withdrawals awarded to CS users as compared to previous semesters of the same courses not using CS” (2012, p. 2).
A Surprising Result:
“While this aspect needs to be further investigated, early indications show that lesser-prepared students, with the addition of CS to difficult courses, are faring better with academic success and retention to Purdue than their better-prepared peers in courses not utilizing Course Signals” (2012, p. 3).
Conclusion
Course Signals at Purdue is doing great work that is having a measurable and practical impact on the lives of students. Nevertheless, much work is to be done. I asked Arnold and Pistilli after their presentation at LAK12 what was being done to measure learning and the effect of effective instructional and learning practices, not just measuring grades and retention. They recognized that the learning nut had not been cracked, but that there was a program at Purdue to transition classes to more effective learning practices beyond direct instruction. Even so, an effort to come up with metrics of learning as a result of these innovative learning practices had not yet been developed.
The surprising result of less prepared students who took Signals-enabled classes performing better than better prepared students who did not take a Signals-enabled class is potently a paradigm shattering finding. If students with lower entrance qualifications can perform at a much higher level and have a much higher likelihood of graduation as a result of a single technology, why then would the college not be able to admit a broader range of students? How much better would the prepared students do with the technology as well? What could this mean for graduate education? Could entrance standards be lowered across the board all while increasing student performance?
Course Signals seems to have enabled mass replication of Vygotsky’s zone of proximal development (ZPD), enabling many students at once to increase their ZPD or true development level with minimal instructor resources. Is the Holy Grail of Ed Tech within reach? It will be interesting to see how well this effect endures across other institutions that use SunGard’s licence of Course Signals or when the outcomes are competency- or learning outcome-based rather than grade- or retention-based. It will also be interesting to see if the same effect is observed (once they have the data) in the similar technologies that were presented at LAK12, including: U of M’s e2Coach, D2L’s Student Success System (which had the best design), Sherpa, and GLASS.
References
Arnold, K. E., & Pistilli, M. D. (2012). Course Signals at Purdue: Using Learning Analytics to Increase Student Success. 978-1-4503-1111-3/12/04. Presented at the Second International Conference of Learning Analytics and Knowledge 2012 (LAK12), Vancouver, BC, Canada: ACM.

Purdue is the correct spelling, please.
By: Greg Kline on May 18, 2012
at 8:04 am
Greg thanks for your help. Spelling is my downfall. Appreciate your feedback very much. Michael
By: Michael Atkisson on May 18, 2012
at 8:19 am
Thank you Michael for a very good recap of the presentation on Course Signals.
By: Greg Kline on May 18, 2012
at 9:49 am
Thanks Greg. Would love to hear if your experience with Course Signals matches with the aggregate reporting.
By: Michael Atkisson on May 18, 2012
at 10:50 am